Country exposure · WE
West Bank administered by Israel
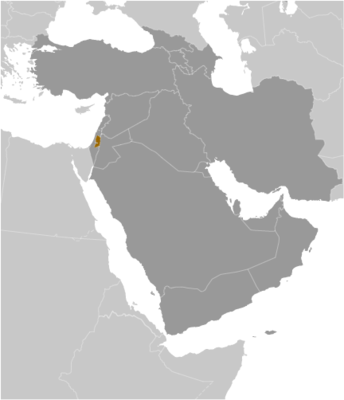
Middle East
What West Bank administered by Israel means for your money, the prices you pay, the tariffs in motion, and where U.S. policy could change both.
$5M
U.S. imports, 2025
-17.1%
change in one year
$4M
U.S. exports, 2025
3M
Population
$13.7B
GDP
In your house
What you buy that West Bank administered by Israel makes
America bought $5M in goods from West Bank administered by Israel in 2025, down 17.1% in a single year. Of every $100 of it, here's where the money went.
Food oils, oilseeds
Fruits, frozen juices
fruit and frozen juices
Vegetables
vegetables
Minimum value shipments
Cell phones and other household goods, n.e.c.
cell phones and home electronics
Footwear
shoes and sneakers
Tea, spices, etc.
tea and spices
Nuts
nuts
Other foods
Wine, beer, and related products
wine and beer
2026 so far (through May): $3M in imports. Source: U.S. Census Bureau, International Trade in Goods (customs basis).
The other direction
What America sells to West Bank administered by Israel
$4M in 2025, a trade rupture cuts both ways, for American producers as well as American prices.
Plastic materials
$895Kplastics for packaging and goods
Passenger cars, new and used
$888Knew and used cars
Pharmaceutical preparations
$708Kmedicines and pharmacy items
Computer accessories
$504Kkeyboards, drives, computer parts
Medicinal equipment
$253Kmedical devices and equipment
Toiletries and cosmetics
$137Ktoiletries and cosmetics
Chemicals-other
$108KMeasuring, testing, control instruments
$96KLaboratory testing instruments
$59KWhere you stand
U.S. tariff posture toward West Bank administered by Israel
No U.S. tariff action singles this country out. Its goods face the universal 10% temporary import surcharge under Section 122 of the Trade Act (which replaced the IEEPA reciprocal baseline in February 2026) plus the sectoral Section 232 duties — steel and aluminum at 50% — that apply to all countries. The Section 122 surcharge is statutorily temporary — scheduled to lapse on or about July 23, 2026 (a 150-day cap) unless extended or replaced.
Reciprocal tariff (universal baseline)
10%
The universal 10% floor, a Section 122 import surcharge since February 2026, previously the EO 14257 reciprocal baseline, applies to nearly all U.S. imports. This country has no higher assigned rate of its own.
Policy in motion
Tariff status: a moving target
No U.S. tariff action names West Bank administered by Israel. These are the universal measures, applied to every country without a country-specific arrangement, that set its treatment.
2026-04-06
Section 232 metals coverage expanded
In effectThe April 2026 proclamation strengthening Section 232 actions on aluminum, steel, and copper expanded derivative-product coverage for all countries, keeping the general metals rate at 50%.
91 FR 18201 →2026-02-24
IEEPA reciprocal tariffs terminated — replaced by 10% Section 122 surcharge
In effectExecutive Order 14389 (Ending Certain Tariff Actions) terminated the IEEPA tariff duties — including the EO 14257 reciprocal baseline — effective February 24, 2026. A flat 10% Section 122 temporary import surcharge (Proclamation 11012 of February 20, 2026) replaced them, leaving the universal rate unchanged at 10% on a different statutory basis. Section 122 caps such surcharges at 150 days, so this 10% surcharge is scheduled to lapse on or about July 23, 2026 absent further action (the administration has signaled it could raise the rate toward the 15% statutory maximum).
91 FR 9437 →2025-11-13
Agricultural products exempted from reciprocal tariffs
In effectExecutive Order 14360 of November 14, 2025 removed reciprocal duties from certain agricultural products listed in its annexes (coffee, cocoa, bananas, and other goods the U.S. does not produce in sufficient quantity), retroactive to November 13, 2025 — for all countries subject to the reciprocal tariff.
90 FR 54091 →2025-06-04
Section 232 steel and aluminum duties doubled to 50%
In effectThe June 3, 2025 proclamation raised Section 232 duties on steel and aluminum articles and derivatives from 25% to 50% for all countries, effective June 4, 2025.
90 FR 24199 →2025-04-05
Universal 10% reciprocal baseline takes effect
In effectExecutive Order 14257 (signed April 2, 2025) imposed a 10% ad valorem reciprocal duty on imports from all trading partners, effective April 5, 2025. Countries without a higher Annex I rate remain at this baseline.
Federal Register · 2025-06063 →2025-03-12
Section 232 steel and aluminum duties set at 25% for all countries
In effectProclamations of February 10, 2025 terminated all country exemptions and quota arrangements and applied 25% Section 232 duties to steel and aluminum imports from every country, effective March 12, 2025.
90 FR 9817 →
Reference
The country itself
Middle East · Geography, people, economy, and government, public-domain data from the CIA World Factbook.
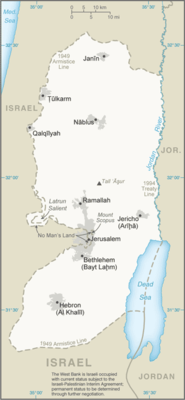
The landlocked West Bank -- the larger of the two Palestinian territories -- is home to some three million Palestinians. Inhabited since at least the 15th century B.C., the area currently known as the West Bank has been dominated by a succession of different powers. In the early 16th century, it was incorporated into the Ottoman Empire. The West Bank fell to British forces during World War I, becoming part of the British Mandate of Palestine. After the 1948 Arab-Israeli War, Transjordan (later renamed Jordan) captured the West Bank and annexed it in 1950; Israel then captured it in the Six-Day War in 1967. Under the Oslo Accords -- a series of agreements that were signed between 1993 and 1999 -- Israel transferred to the newly created Palestinian Authority (PA) security and civilian responsibility for the many Palestinian-populated areas of the West Bank, as well as the Gaza Strip. In addition to establishing the PA as an interim government, the Oslo Accords divided the West Bank into three areas, with one fully managed by the PA (Area A), another fully managed by Israel (Area C), and a third with shared control (Area B) until a permanent agreement could be reached between the Palestine Liberation Organization (PLO) and Israel. In 2000, a violent intifada , or uprising, began across the Palestinian territories, and in 2001, negotiations for a permanent agreement between the PLO and Israel on final status issues stalled. Subsequent attempts to re-start direct negotiations have not resulted in progress toward determining final status of the area. The PA last held national elections in 2006, when the Islamic Resistance Movement (HAMAS) won a majority of seats in the Palestinian Legislative Council (PLC). Fatah, the dominant Palestinian political faction in the West Bank, and HAMAS failed to maintain a unity government, leading to violent clashes between their respective supporters and to HAMAS's violent seizure of all PA military and governmental institutions in the Gaza Strip in 2007. In 2018, the Palestinian Constitutional Court dissolved the PLC. In recent years, Fatah and HAMAS have made several attempts at reconciliation, but the factions have been unable to implement agreements.
Geography
- Location
- Middle East, west of Jordan, east of Israel
- Area
- 5,860 sq km
- Climate
- temperate; temperature and precipitation vary with altitude, warm to hot summers, cool to mild winters
- Terrain
- mostly rugged, dissected upland in west, flat plains descending to Jordan River Valley to the east
- Natural resources
- arable land
- Coastline
- 0 km (landlocked)
- Natural hazards
- droughts
People & society
- Population
- 3,310,554 (2025 est.)
- Ethnic groups
- Palestinian Arab, Jewish, other
- Languages
- Arabic, Hebrew (spoken by Israeli settlers and many Palestinians), English (widely understood)
- Religions
- Muslim 80-85% (predominantly Sunni), Jewish 12-14%, Christian 1-2.5% (mainly Greek Orthodox), other, unaffiliated, unspecified <1% (2012 est.)
- Median age
- 22 years (2025 est.)
- Life expectancy at birth
- 76.5 years (2024 est.)
- Literacy
- 98% (2022 est.)
Economy
- Industries
- small-scale manufacturing, quarrying, textiles, soap, olive-wood carvings, and mother-of-pearl souvenirs
- Agricultural products
- tomatoes, cucumbers, olives, poultry, milk, potatoes, sheep milk, eggplants, gourds
- Exports - partners
- Jordan 51%, Turkey 12%, UAE 8%, Saudi Arabia 5%, UK 4% (2023)
- Imports - partners
- Egypt 25%, Jordan 17%, China 8%, Germany 7%, UAE 7% (2023)
Full reference data
Every field, by section, CIA World Factbook. Open a topic to expand it.